Benchmarking LLM Serving Stacks: Production Patterns and Realistic Load Testing
 Apr, 4 2026
If you've ever deployed a large language model and seen it crumble the moment more than five users hit the endpoint, you know that "it works on my machine" is a dangerous lie in AI infrastructure. Most teams make the mistake of measuring performance in a vacuum-sending a few prompts and celebrating the speed. But in the real world, LLM serving stacks face erratic burst patterns, varying prompt lengths, and the dreaded "cold start" that can tank your user experience. To actually know if your stack can handle production, you need to stop guessing and start benchmarking with realistic loads.
The Big Divide: Load Testing vs. Performance Benchmarking
Before you start spinning up GPUs, you need to understand that you're actually measuring two different things. It's easy to confuse them, but treating them as the same is how you end up with a system that is fast for one person but unusable for a thousand.
Performance benchmarking is all about the "how fast." It isolates the model's efficiency. You're looking at how quickly a single request is processed or how many tokens the engine can spit out per second. It's a controlled environment where you're testing the software's theoretical ceiling. On the other hand, load testing asks "how many." This is where you simulate a crowd. You aren't just checking if the model is fast; you're checking if the server crashes, if the autoscaling kicks in fast enough, or if the network latency becomes the actual bottleneck.
Think of it like testing a car. Performance benchmarking is the 0-60 mph sprint on a dry track. Load testing is putting that car in rush-hour traffic in downtown New York to see if it can actually get anywhere. You need both to ensure your deployment doesn't just look good in a demo but survives the real world.
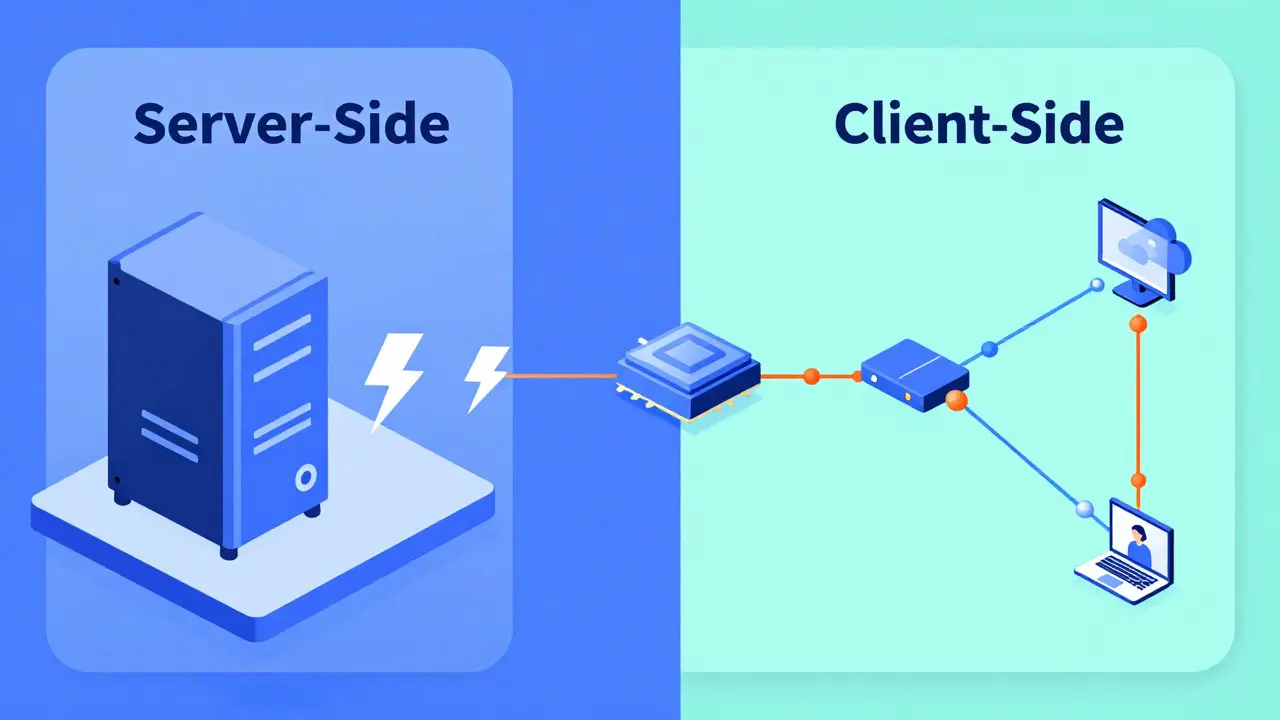
Where You Measure Matters: Server-Side vs. Client-Side
One of the most common pitfalls in LLM benchmarking is ignoring the network. Depending on where your benchmark script lives, you're getting two completely different sets of data.
If you run your benchmarks on the same machine as your model server-what we call server-side benchmarking-you're essentially stripping away the internet. This is great for hardware characterization. It tells you exactly what your GPU and memory are capable of without the noise of a slow router or a congested VPC. If you want to compare an H100 against an A100, do this.
But if you want to know what your users feel, you must use client-side benchmarking. This involves running requests from a separate instance, mirroring the actual path a user's prompt takes. This captures the TCP handshake, the load balancer overhead, and the actual transit time. The golden rule here is simple: server-side tells you the maximum hardware capability; client-side tells you the actual user experience.
Key Metrics That Actually Move the Needle
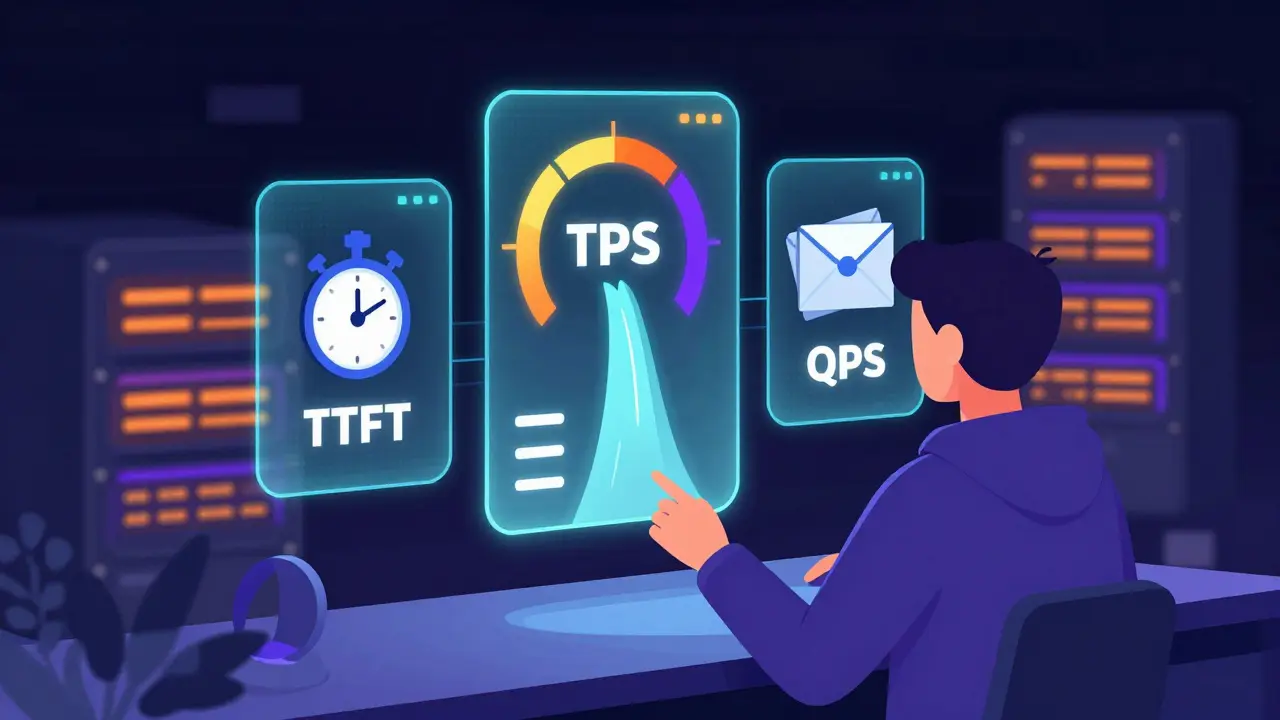
Forget generic "latency" numbers. In the world of generative AI, the way tokens are delivered makes the difference between a tool that feels magical and one that feels broken. You need to track these specific indicators:
- Time-to-First-Token (TTFT): This is the most critical metric for perceived speed. It's the gap between when a user hits "Enter" and when the first word appears. If this is too high, users think the app is frozen.
- Tokens Per Second (TPS): This measures the actual throughput. While TTFT is about the start, TPS is about the flow. If the TPS is lower than the average human reading speed, the experience feels sluggish.
- Queries Per Second (QPS): This is your volume metric. How many distinct requests can your stack handle every second before the queue starts backing up?
- Requests Per Second (RPS): Similar to QPS, but often used in the context of raw network load and API gateway capacity.
| Metric | What it Measures | Ideal Value | User Impact |
|---|---|---|---|
| TTFT | Initial Response Delay | Low (e.g., < 0.8s) | Perceived Responsiveness |
| TPS | Generation Speed | High | Reading Fluidity |
| QPS | System Capacity | High | Scalability / Cost |
| P90 Latency | Tail End Delay | Low | Consistency (Avoiding "Hangs") |
Designing Realistic Production Patterns
Synthetic tests that send the same "Hello, how are you?" prompt 1,000 times are useless. They allow the system to cache the response, giving you fake, inflated numbers. To get a real picture, you need to implement a tiling pattern or a dynamic prompt strategy.
A realistic test should cycle through a diverse set of contexts. For example, if you're building a coding assistant, your benchmarks should mix short logic questions with massive 10k-token file uploads. This forces the server to manage KV Cache (Key-Value Cache) evictions and offloading, which is where most serving stacks fail. When the cache fills up, the system has to decide what to dump or how to swap memory, and that's when you'll see your TTFT spike.
Another production reality is the "warm-up" phase. Most LLM engines have a cold-start period where the first few requests are slow as the GPU kernels initialize. If you include these in your average, your data is skewed. Professional setups ignore the first 30-60 seconds of data and focus on the "steady state"-the performance level the system maintains after it's fully warmed up.
Choosing Your Serving Stack: vLLM, SGL, and Others
The infrastructure you choose dictates your performance ceiling. For a long time, vLLM has been the gold standard due to its PagedAttention mechanism, which optimizes how memory is handled for concurrent requests. It's reliable, open-source, and handles batching efficiently.
However, newer contenders like SGL (Structured Generation Language) are entering the fray. Early data suggests that in specific high-concurrency scenarios, SGL can outperform vLLM by optimizing the way it handles structured outputs. But don't just follow the leaderboard; the "best" stack depends on your specific model. A stack that excels with a 7B parameter model might struggle with a 70B model due to different memory pressures.
If you're dealing with massive models, you'll need to look at parallelism strategies. Tensor Parallelism (TP) splits the model's weights across multiple GPUs, while Pipeline Parallelism (PP) splits the model layers. Finding the right balance-like a TP2:PP1 configuration-is often the only way to hit a P90 latency target of 2 seconds for a large-scale deployment.
The Iteration Loop: Shortening the Feedback Cycle
You won't find the perfect configuration on your first try. You'll change the batch size, tweak the max sequence length, and adjust your GPU memory utilization, then run the test again. If this process takes an hour, you'll stop optimizing. If it takes five minutes, you'll find the peak.
To speed this up, invest in developer experience (DevEx) for your infra. Use automation scripts (like a simple startup_and_benchmark.sh) that boot the server, run the load test, and dump the results into a CSV. Also, leverage weight caching. There is nothing more wasteful than spending twenty minutes redownloading a 100GB model every time you want to test a new concurrency setting.
Combine this with real-time monitoring using Prometheus and Grafana. This allows you to see the correlation between a spike in GPU memory and a drop in TPS in real-time, rather than digging through logs after the crash.
What is a realistic P90 latency target for LLMs?
While it depends on the model size, a common production target is a P90 Time-to-First-Token (TTFT) of around 2 seconds. This means 90% of your users will see the start of a response within 2 seconds, preventing the feeling that the system is unresponsive.
Why is the first 60 seconds of a benchmark usually ignored?
This is due to the "cold start" effect. GPUs and software frameworks need time to initialize kernels, load weights into the cache, and stabilize memory allocation. Including this initial spike would artificially inflate your average latency and misrepresent steady-state performance.
Should I use synthetic or production data for load testing?
You need both. Synthetic data (using tools like DeepSpeed) allows you to test controlled, edge-case scenarios and find the absolute breaking point. Production data (real user queries) is essential for capacity planning and ensuring your Service Level Objectives (SLOs) are met in real-world usage.
What is the difference between TPS and QPS?
QPS (Queries Per Second) measures how many total requests the system completes per second. TPS (Tokens Per Second) measures the volume of text being generated. A system might have high QPS if it's giving short answers, but low TPS if those answers are only a few words long.
How does PagedAttention improve serving performance?
PagedAttention, used by vLLM, manages the KV cache by treating memory like virtual memory in an OS. Instead of allocating a large contiguous block of memory for a request, it uses pages, significantly reducing memory fragmentation and allowing for much higher concurrency (more requests processed at once).
k arnold
April 5, 2026 AT 06:30Wow, imagine thinking PagedAttention is some secret revolutionary magic when it's literally just virtual memory for GPUs. Groundbreaking stuff here folks. 🙄
Teja kumar Baliga
April 5, 2026 AT 20:23Great breakdown of the metrics! TTFT is definitely the one users notice most. 🚀
Alan Crierie
April 6, 2026 AT 00:02The distinction between server-side and client-side benchmarks is so vital for an honest evaluation 🌟. It's easy to forget the network overhead until the system fails in the wild! 😊
Nicholas Zeitler
April 6, 2026 AT 19:00Spot on!!! The part about ignoring the first 60 seconds is a total game-changer for anyone doing this for the first time!!! Keep it up!!!
lucia burton
April 7, 2026 AT 07:44Implementing a dynamic prompt strategy to avoid cache-hit inflation is absolutely paramount because if you are merely iterating on a static dataset you are effectively ignoring the stochastic nature of KV cache eviction policies and the subsequent impact on throughput and tail latency in a high-concurrency environment where memory pressure is the primary bottleneck for throughput scalability. We really need to push for more rigorous telemetry regarding the interplay between tensor parallelism and the actual throughput of the inference engine to truly optimize the hardware utilization of A100s or H100s in a production cluster!
Tiffany Ho
April 7, 2026 AT 23:38this is so helpful i like how it explains the metrics in a simple way
michael Melanson
April 9, 2026 AT 17:34I agree with the point about vLLM being the gold standard for now. It's just more stable for most use cases.
Denise Young
April 11, 2026 AT 13:01Oh sure, let's just assume everyone has a cluster of H100s lying around to test these "realistic" production patterns while we pretend that the overhead of a complex orchestration layer doesn't completely negate the marginal gains of switching from vLLM to SGL in a typical Kubernetes-based deployment architecture where the network hop is practically the entire bottleneck anyway. It's just so adorable how we focus on microseconds of GPU kernel initialization while the actual API gateway is adding half a second of latency just to authenticate the request, which is obviously the most critical part of the user experience, right?
Sam Rittenhouse
April 12, 2026 AT 03:01My heart actually sinks thinking about the countless developers who have deployed their models only to have them shatter under the weight of a real-world load! The sheer tragedy of a "works on my machine" disaster is a nightmare no one should ever have to endure! It is truly a harrowing experience to watch your latency spike into the stratosphere while your users vanish into the void of frustration!