LLM Inference Observability: Mastering Token Metrics, Queues, and Tail Latency
 Nov, 7 2026
You ship your Large Language Model (LLM) to production, watch the dashboard, and see a healthy green light. Requests per second look stable. CPU usage is normal. But then support tickets start rolling in: "Why is the chatbot freezing?" or "The response took forever." What happened?
Here’s the trap most teams fall into: they treat LLM inference like traditional web services. They monitor requests per second (RPS) and average latency. But LLMs are different beasts. A single request might generate 5 tokens, while another generates 2,000. If you only watch RPS, you miss the fact that one heavy request can block the queue for everyone else. This is where LLM observability becomes critical. It’s not just about checking if the server is up; it’s about understanding the behavior of token generation, queue dynamics, and tail latency in real-time.
Why Traditional Metrics Fail LLMs
In a standard REST API, work per request is relatively uniform. In LLM inference, work is wildly variable. The cost of a request isn't defined by whether it hit the endpoint, but by how many tokens it processes and generates. This variability means that "requests per second" can appear perfectly stable even as your system collapses under the weight of long-context inputs or verbose outputs.
Consider this scenario: Your average latency looks great at 500ms. But if the 99th percentile (P99) is 10 seconds, your user experience is broken. Most users don’t care about the average; they care about their specific interaction. If one outlier request jams the GPU batch, the next ten users wait. This is why focusing on averages is dangerous. You need to track the distribution of work, specifically through token counts and time-to-first-token (TTFT).
Token Metrics: The Foundation of Visibility
Token metrics are the bedrock of LLM monitoring. You aren't just counting bytes; you're counting units of computational work. The core distinction you must make is between input tokens (prompt processing) and output tokens (generation). These two phases have completely different performance characteristics.
Input tokens affect the prefill phase, which determines Time-to-First-Token (TTFT). Output tokens affect the decode phase, which determines inter-token latency and total generation time. When you monitor these separately, you can pinpoint bottlenecks. Is the model slow because the prompt is massive? Or is it slow because the model is struggling to generate coherent text?
| Metric Name | What It Measures | Why It Matters |
|---|---|---|
| Time-to-First-Token (TTFT) | Latency before the first character appears. | Directly impacts perceived responsiveness. High TTFT makes apps feel frozen. |
| Inter-Token Latency | Time between generated tokens. | Determines if streaming feels fluid or choppy. |
| Total Generation Time | End-to-end duration for full completion. | Critical for non-streaming APIs and background tasks. |
| Token Throughput | Tokens processed/generated per second. | More accurate than RPS for capacity planning. |
Tools like vLLM and Text Generation Inference (TGI) explicitly export these telemetry points. For instance, `vllm:time_to_first_token_seconds` is a histogram metric. Don't just look at the mean. Look at the P95 and P99. Research from Glean shows that for every additional input token, P95 TTFT increases by roughly 0.24ms. That sounds small, but multiply that by a 10,000-token context window, and you’re looking at significant delays before the user sees anything.
The Hidden Killer: Queue Dynamics
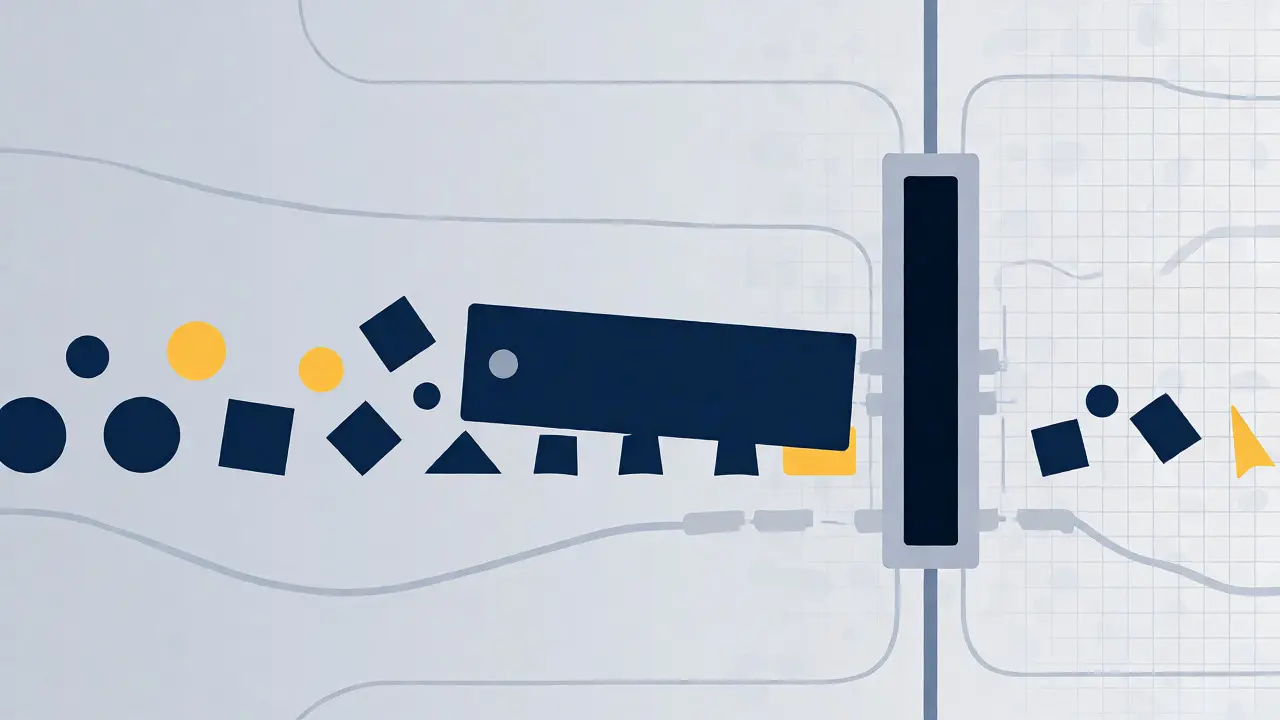
If token metrics tell you what the workload is, queue metrics tell you how the system handles it. LLM inference engines use batching to maximize GPU efficiency. They group multiple requests together to process them in parallel. But when the system gets busy, requests pile up in a queue.
This is where the concept of "impatient users" comes into play. According to queueing theory models applied to LLMs, heavy-tailed distributions of output lengths create chaos. One request asking for a 3,000-word essay blocks the batch longer than fifty short Q&A queries. If your queue depth spikes, new requests wait longer for an available replica or batch slot.
You must monitor queue wait time and queue size as first-class indicators. TGI exposes these directly. If your queue size grows consistently during peak hours, you’re under-provisioned. But here’s the tricky part: simply adding more GPUs doesn’t always fix it if your batching strategy is inefficient. You need to balance maximum batch size against latency. Larger batches increase throughput but also increase the time each individual request spends waiting for its turn in the batch.
Tail Latency: Where User Experience Dies
Average latency is a vanity metric. Tail latency is the truth. In distributed systems, we often talk about P99-the 99th percentile. In LLMs, this is exacerbated by the stochastic nature of generation. Sometimes the model hits a complex reasoning path; other times it’s straightforward.
Kong’s AI Observability Guide highlights that latency problems become apparent when TTFT jumps from milliseconds to several seconds. Users perceive this as a crash. LogicMonitor reinforces this: "Nobody cares about your average if the 99th percentile is terrible." To combat this, you need to instrument your system to capture histograms, not just counters. Histograms allow you to calculate percentiles dynamically.
One effective mitigation strategy identified in recent arXiv research is enforcing a maximum output token limit. By capping the length of responses for a small fraction of requests, you can significantly reduce queueing delay. Yes, you lose some completeness for those outliers, but you save the overall system stability. This trade-off requires data-driven decisions based on your specific traffic patterns.

Practical Implementation: Tools and Standards
So, how do you actually build this? You need a stack that supports OpenTelemetry semantic conventions for GenAI. Standardized names like `gen_ai.server.time_to_first_token` ensure that your dashboards remain consistent regardless of the underlying model provider.
Start with these steps:
- Instrument your serving layer: Use vLLM or TGI which natively expose Prometheus-compatible metrics for tokens and latency.
- Track Cost Per Interaction: Different models have vastly different price tags. Monitor token consumption aggregated by user and feature to catch runaway costs early.
- Set Alerts on Percentiles: Don’t alert on average latency. Alert when P95 TTFT exceeds your SLO (e.g., 500ms).
- Monitor Error Rates & Timeouts: High timeout rates often correlate with deep queues. Track these alongside token volume.
Platforms like LangChain and BentoML offer higher-level abstractions that capture prompts, completions, and metadata alongside raw metrics. This contextual data is vital. Knowing that latency spiked is useful; knowing that it spiked for users submitting PDFs over 50 pages is actionable.
Conclusion: Observability is Non-Negotiable
Running LLMs in production without deep observability is like flying blind in a storm. You might survive, but you won’t know why you crashed. By focusing on token metrics, understanding queue dynamics, and obsessing over tail latency, you move from reactive firefighting to proactive optimization. The infrastructure is ready; your monitoring needs to be too.
What is Time-to-First-Token (TTFT)?
TTFT is the latency measured from the moment a request is sent until the first token is received by the client. It primarily reflects the time spent processing the input prompt (prefill stage). High TTFT makes applications feel unresponsive, even if the subsequent text streams quickly.
Why are requests per second unreliable for LLMs?
Because the computational work per request varies drastically. A request generating 10 tokens consumes far fewer resources than one generating 1,000 tokens. Monitoring RPS alone hides these variations, leading to false positives in health checks and missed capacity issues.
How does queueing affect LLM latency?
LLM servers use batching to optimize GPU usage. When demand exceeds capacity, requests wait in a queue. Long-running requests (heavy tails) can block batches, increasing wait times for all queued users. Monitoring queue depth and wait time helps identify saturation before user experience degrades.
What is tail latency in LLM inference?
Tail latency refers to the high-percentile latencies (like P95 or P99) rather than the average. In LLMs, a few complex or long-generation requests can skew the distribution, causing some users to experience multi-second delays while others finish instantly. Focusing on tail latency ensures a consistent user experience.
Which tools provide native LLM observability metrics?
Popular inference engines like vLLM and Hugging Face Text Generation Inference (TGI) natively export metrics compatible with Prometheus. Additionally, platforms like LangChain, BentoML, and Kong provide higher-level observability layers that track token usage, cost, and latency distributions.
Alice Clark
November 7, 2026 AT 15:04theyre just hiding the real costs in plain sight and calling it optimization while we all pretend the green lights mean anything