Observability and SRE Practices for Self-Hosted Large Language Models
 Aug, 2 2026
Why Monitoring Your Own LLM Is Harder Than You Think
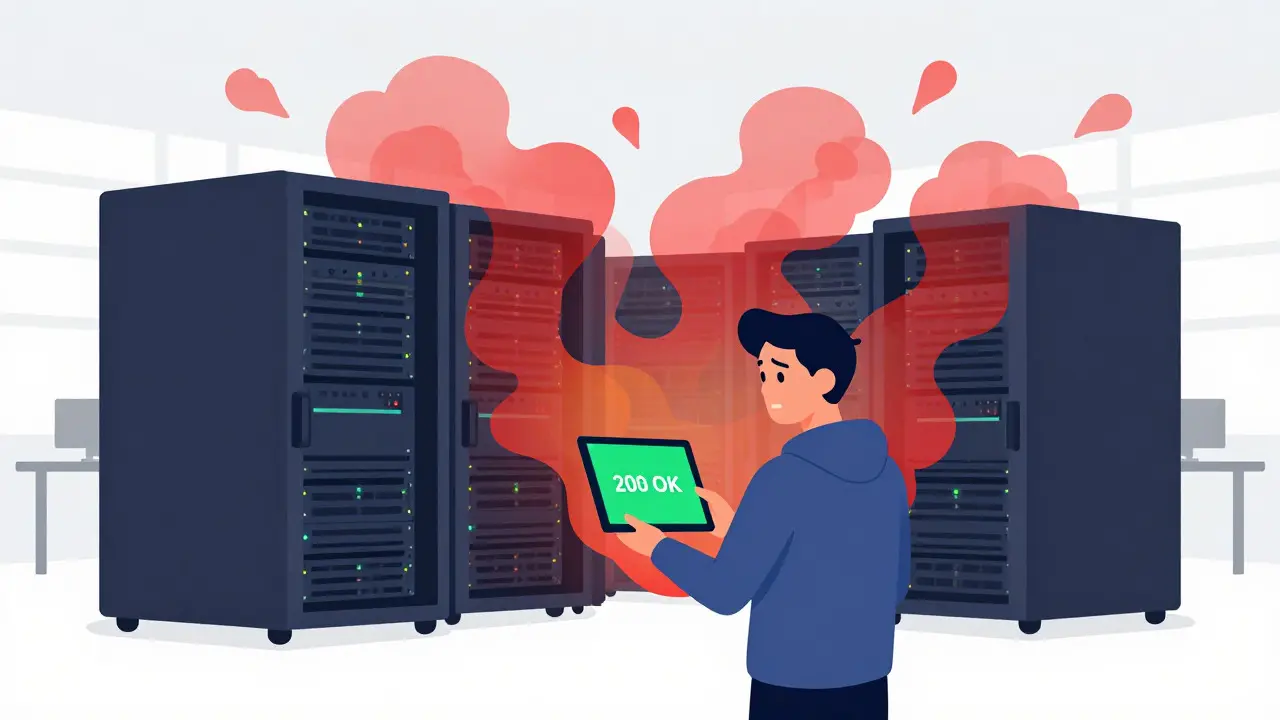
You’ve spent weeks fine-tuning your model. You’ve got the GPU cluster humming in your private cloud or on-prem data center. The inference server is up, and the API endpoints are responding. But here’s the reality check: running a self-hosted Large Language Model is not like hosting a standard web app. If your database connection drops, you get a 503 error. If your LLM starts hallucinating, drifting, or choking on context windows, the HTTP status code still says 200 OK. The system is "up," but it’s useless.
This is where traditional Site Reliability Engineering (SRE) meets its match. In 2026, we’re seeing a shift from simply deploying models to actively managing their operational health. The gap between knowing your model is running and knowing it’s performing correctly is filled by observability. Without it, you’re flying blind. And if you’re thinking about letting an AI monitor another AI to save headcount, you might want to read the latest findings before automating your way into trouble.
The Myth of Autonomous Root Cause Analysis
It sounds too good to be true: use an advanced LLM to analyze your own logs, traces, and metrics to find out why your production environment broke. It’s the holy grail of SRE-zero-touch incident resolution. However, recent experiments suggest this dream is still science fiction.
In early 2026, ClickHouse conducted a rigorous evaluation of autonomous root cause analysis (RCA). They tested top-tier models, including GPT-5, against real-world observability data from live applications instrumented with OpenTelemetry. The setup was controlled: they generated synthetic anomalies by spiking load to 1,000 users, toggling feature flags, and creating distinct error patterns over one-hour and 48-hour datasets.
The results were sobering. Even the most capable models failed to consistently outperform experienced human SREs. Some models went off-track, requiring significant human guidance to stay on task. Others produced plausible-sounding but incorrect diagnoses. The takeaway isn’t that AI is useless in operations; it’s that autonomous RCA is not yet viable. Instead of replacing engineers, these tools work best as assistants-summarizing findings, drafting updates, and suggesting next steps while a human retains control of the investigation.
| Approach | Accuracy | Human Intervention Required | Best Use Case |
|---|---|---|---|
| Autonomous LLM RCA | Inconsistent | High (frequent correction needed) | Not recommended for critical prod issues |
| Assisted LLM Investigation | High (with human oversight) | Low (guidance only) | Summarization, draft resolutions, pattern recognition |
| Traditional Manual RCA | High | N/A | Baseline for complex, novel failures |

What Metrics Actually Matter for Self-Hosted LLMs?
If you’re deploying your model on Kubernetes using frameworks like vLLM, you need to look beyond CPU usage and memory allocation. Standard infrastructure metrics tell you if your servers are alive, but they don’t tell you if your model is serving quality responses. You need application-specific telemetry.
Here are the critical metrics you should be scraping via Prometheus:
- vllm_num_requests_running: This tracks how many requests are currently being processed by the engine. If this number stays high while throughput drops, you have a bottleneck.
- vllm_num_requests_waiting: This measures the queue length. A growing wait time indicates you’re under-provisioned or experiencing cold start delays.
- vllm_gpu_cache_usage_perc: GPU memory cache utilization is vital. High usage can lead to evictions, causing latency spikes. Low usage might mean you’re wasting expensive hardware resources.
- vllm_avg_generation_throughput_toks_per_s: This is your speedometer. It measures token generation speed. Drops here directly impact user experience, especially in real-time chat applications.
To capture these, you’ll need to create a Kubernetes ServiceMonitor that configures Prometheus to scrape vLLM endpoints automatically. Don’t just set it and forget it. Pair these infrastructure metrics with response quality checks. Tools like Openlit or OneUptime can help bridge the gap between raw telemetry and semantic understanding of what your model is actually outputting.
SRE Strategies for GenAI Infrastructure
Managing LLMs requires a different mindset than traditional DevOps. As noted by the Cloud Native Computing Foundation (CNCF) in 2025, LLMs introduce new variables: non-deterministic outputs, massive context window dependencies, and variable latency based on prompt complexity. Your SRE practices must evolve to handle these nuances.
Start by defining clear Service Level Objectives (SLOs) that go beyond uptime. Consider:
- Latency Percentiles: P95 and P99 latency for token generation. Users notice lag when generating long responses.
- Error Rates by Type: Distinguish between network timeouts, OOM (Out of Memory) kills, and semantic errors (hallucinations).
- Cost per Token: Monitor GPU efficiency to ensure you aren’t burning cash on idle cycles or inefficient batching.
When incidents occur, your runbooks should include specific troubleshooting paths for LLM behaviors. For example, if latency spikes, check the GPU cache eviction rate first. If quality degrades, inspect the input context lengths for outliers. Traditional alerting noise reduction techniques apply here too-correlate signals across monitoring systems to avoid paging your team for every minor fluctuation.
The Emerging Role of AI-Native Automation
While full autonomy is still out of reach, AI-native Kubernetes automation is maturing quickly. By mid-2026, platforms are integrating LLMs directly into control loops to assist with scaling and remediation. These aren’t magic buttons, but intelligent helpers that reduce manual toil.
Key capabilities emerging in this space include:
- Autopilot Scaling: Using ML models alongside LLMs to predict workload patterns and adjust horizontal pod autoscaling (HPA) thresholds dynamically. This reduces the guesswork in right-sizing clusters.
- Smart Sizing: Vertical scaling recommendations based on historical resource usage. The system suggests optimal CPU and memory requests for new deployments, optimizing cost without sacrificing performance.
- Pod Recovery AI: When a container crashes or enters a restart loop, LLM-powered agents analyze logs and events to diagnose the issue. They can suggest fixes or trigger predefined recovery actions, such as restarting dependent services or rolling back deployments.
These tools excel at handling repetitive, pattern-based issues. They free up your SREs to focus on architectural improvements and novel problems. However, always keep a human in the loop for critical changes. An automated rollback triggered by a misdiagnosed anomaly could cause more harm than the original issue.
Building Your LLMOps Checklist
Transitioning from MLOps to LLMOps means expanding your operational scope. Here’s a practical checklist to ensure your self-hosted LLM environment is robust:
- [ ] Implement OpenTelemetry instrumentation across all service layers.
- [ ] Configure Prometheus to scrape vLLM-specific metrics (running requests, queue depth, GPU cache, throughput).
- [ ] Define SLOs for latency, accuracy, and cost efficiency.
- [ ] Set up alerts for anomalous behavior, not just threshold breaches.
- [ ] Test disaster recovery procedures, including model version rollbacks.
- [ ] Evaluate AI-assisted tools for log summarization and initial triage.
- [ ] Conduct regular chaos engineering exercises to validate resilience.
Remember, LLMOps is not a one-time setup. It’s an ongoing discipline. As models grow larger and more complex, so do the operational challenges. Stay curious, keep testing, and don’t trust the black box entirely. Your job as an SRE is to bring light into the dark corners of your infrastructure.
Can LLMs fully replace SREs in root cause analysis?
No. As of 2026, autonomous LLM-driven root cause analysis has proven unreliable in production environments. While LLMs can assist by summarizing logs and suggesting hypotheses, human oversight remains essential for accurate diagnosis and decision-making.
What are the most important metrics for monitoring vLLM?
Critical metrics include vllm_num_requests_running, vllm_num_requests_waiting, vllm_gpu_cache_usage_perc, and vllm_avg_generation_throughput_toks_per_s. These provide insight into queue depth, hardware utilization, and generation speed.
How does LLMOps differ from traditional MLOps?
LLMOps focuses on the unique challenges of large language models, such as non-deterministic outputs, context window management, and semantic drift. Traditional MLOps often deals with structured data pipelines and deterministic predictions, whereas LLMOps requires monitoring for qualitative aspects like hallucination rates and token efficiency.
Is AI-native Kubernetes automation ready for production?
Partially. Features like Autopilot scaling and Pod Recovery AI are emerging and useful for assistance, but they are not yet fully autonomous. Best practice involves using these tools to augment human SREs rather than replacing them entirely.
Why is GPU cache usage important for LLM performance?
GPU cache stores key-value pairs for attention mechanisms during inference. High cache usage can lead to evictions, causing latency spikes as the system reloads data. Monitoring this metric helps optimize batch sizes and prevent performance degradation.
Zach Loescher
August 3, 2026 AT 02:32the part about autonomous rca being science fiction really resonates with me because i've seen too many teams try to automate away the human element and end up with more chaos than before
it's funny how we keep chasing this dream of zero-touch operations when the reality is that context matters so much in these complex systems
i wonder if the issue is just that our models aren't trained on enough specific operational data or if it's fundamentally a logic gap that llms can't bridge yet
maybe we need a hybrid approach where humans define the boundaries and ai fills in the gaps rather than trying to let it drive the whole car
Quintin Franzese
August 4, 2026 AT 21:00oh great another article telling us that ai isn't magic after all who could have guessed
seriously though the clickhouse study results are pretty damning for anyone selling 'set it and forget it' monitoring solutions
i mean sure the table says assisted investigation has high accuracy but that's only if you actually have an engineer sitting there watching it which defeats the purpose of saving headcount doesn't it
looks like we're still stuck doing the heavy lifting while the ai plays secretary
alex kobri
August 6, 2026 AT 15:55you know what i think the real problem here is that we treat observability as a checkbox item instead of a continuous practice
like sure you can scrape prometheus metrics for vllm_num_requests_running but do you actually understand what those numbers mean in the context of your specific user base
most people just copy paste dashboards from github without thinking about the semantics behind the data
and then they blame the tool when things go wrong
it's not about the tech stack it's about the mindset shift from reactive to proactive engineering
we need to stop looking for silver bullets and start building robust processes that include human judgment at every critical step
the gpu cache usage metric is interesting though because it directly correlates with latency spikes which is something users actually feel
so maybe we should focus less on autonomous diagnosis and more on better alerting thresholds that trigger human intervention early
that way we catch issues before they become full blown incidents
also the cost per token metric is crucial because burning cash on idle cycles is a silent killer for startups
if you're not monitoring that you're basically lighting money on fire while pretending everything is fine
so yeah keep the humans in the loop and use ai as a copilot not the pilot
simple as that
Tamara Miller
August 7, 2026 AT 04:03It is absolutely infuriating that companies continue to push these half-baked AI solutions into production environments without adequate testing; one would think that basic due diligence was a thing in 2026, but apparently, speed to market trumps reliability every single time.
The article correctly identifies that autonomous RCA is not viable, yet I see countless CTOs ignoring this reality because they want to tell their boards they are 'AI-native.' It is sheer negligence to rely on probabilistic models for deterministic infrastructure decisions.
Furthermore, the lack of emphasis on semantic drift in most standard SRE playbooks is a glaring oversight that exposes organizations to significant risk.
If you are not actively monitoring for hallucinations and context window choking, you are not running an LLM; you are running a liability waiting to happen.
It is pathetic that we still need to remind engineers that HTTP 200 OK does not mean the output is correct.
Wake up and smell the coffee, people.
Susan Cole
August 8, 2026 AT 01:44the checklist at the end is actually quite useful especially the part about chaos engineering exercises
i've been meaning to implement open telemetry across our services but always put it off until now
thanks for sharing this perspective