Service Level Objectives for Maintainability: Indicators and Alerts
 Jul, 20 2026
We all know the drill. You build a feature, it works, you ship it. But six months later, that same feature is a nightmare to touch. Every change breaks something else. Deployments take hours instead of minutes. The team is exhausted, and customers are seeing bugs they shouldn't have to see. This isn’t just bad luck; it’s a failure of Maintainability the ease with which software systems can be modified, updated, and sustained over time. Traditionally, we’ve measured success by uptime and speed. If the site is up and fast, we’re good, right? Not anymore. Modern engineering demands that we measure how easy it is to keep the system healthy long-term.
This is where Service Level Objectives (SLOs) for Maintainability specialized targets that quantify the operational efficiency of code changes and system evolution come in. They shift the focus from "is it working now?" to "how hard will it be to fix or improve tomorrow?" By setting concrete targets for things like deployment frequency and mean time to recovery, teams stop guessing about their health and start managing it. Let’s look at exactly what these indicators are, why they matter, and how to set alerts that actually help rather than just annoy everyone.
What Are Maintainability SLOs?
To understand maintainability SLOs, you first need to separate them from the standard operational SLOs you might already use. Standard SLOs track availability (e.g., 99.9% uptime) or latency (e.g., response under 200ms). These are critical, yes, but they don’t tell you if your codebase is rotting. A system can be 100% available while being incredibly fragile-meaning one small change could bring it down next week.
Maintainability SLOs measure the friction involved in changing the system. Think of them as a health check for your development process. According to data from Sedai’s analysis of over 1,200 engineering teams, organizations that implement formal maintainability SLOs resolve incidents 47% faster. That’s not a minor improvement; it’s a fundamental shift in how resilient your team is.
The concept evolved from the broader Site Reliability Engineering (SRE) practices pioneered by Google. While early SRE focused heavily on reliability, the industry realized that reliability without maintainability is unsustainable. You can’t keep a system reliable if it takes three weeks to deploy a simple bug fix. Maintainability SLOs bridge that gap, ensuring that today’s stability doesn’t come at the cost of tomorrow’s agility.
Key Indicators: What to Measure
You can’t manage what you don’t measure, but measuring the wrong things is worse. Many teams fall into the trap of tracking vanity metrics like "lines of code changed." That number tells you nothing about quality or ease of maintenance. Instead, focus on Service Level Indicators (SLIs) that directly impact developer experience and system stability.
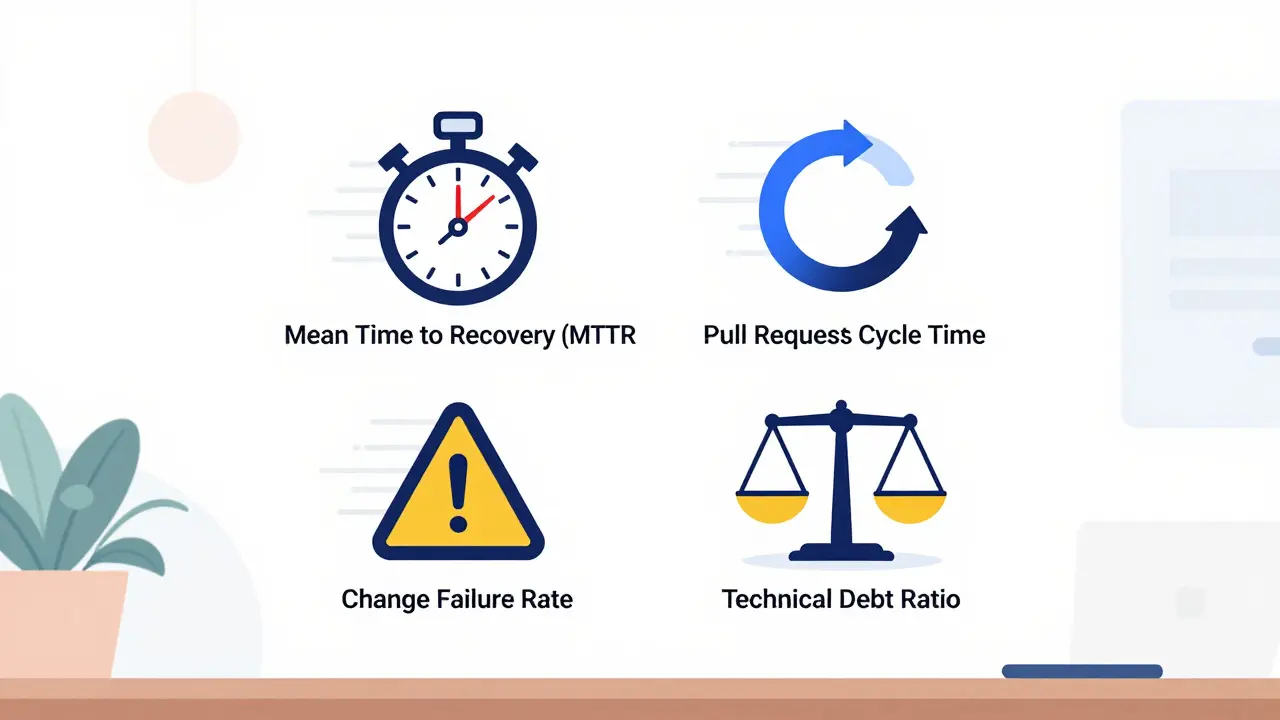
| Indicator | Definition | Target Example | Why It Matters |
|---|---|---|---|
| Mean Time to Recovery (MTTR) | Time taken to restore service after an incident | < 1 hour | Measures how quickly the team can respond to failures without panic. |
| Pull Request Cycle Time | Time from PR creation to merge | < 24 hours | Indicates bottlenecks in review processes and code complexity. |
| Change Failure Rate | % of deployments causing a failure in production | < 5% | Reflects the quality of testing and deployment pipelines. |
| Technical Debt Ratio | Cost to fix issues vs. cost to develop new features | < 15% | Tracks the accumulation of shortcuts that slow future work. |
Notice that these metrics are actionable. If your Pull Request Cycle Time spikes, you know immediately that reviews are getting stuck or the code is too complex. If your Change Failure Rate rises, your testing pipeline is likely broken. These aren’t abstract numbers; they are direct signals of where your engineering process is breaking down.
Setting Realistic Targets and Error Budgets
One of the biggest mistakes teams make is copying targets from elite performers without considering their own context. The DORA State of DevOps Report highlights that elite teams deploy multiple times per day, while low-performing teams may deploy once a month. If you’re currently deploying monthly, aiming for daily deployments tomorrow is a recipe for disaster.
Start with your baseline. Look at the last six months of data. What was your average MTTR? What was your typical PR cycle time? Set your initial SLO slightly better than your current average, not drastically so. For example, if your current MTTR is two hours, aim for 90 minutes. As you improve, tighten the target.
Error budgets work differently for maintainability than for availability. In availability, an error budget might be 0.1% downtime per year. For maintainability, the "error" is often a delay or a failed change. An acceptable error budget for "changes requiring follow-up fixes" might be 15%. This means you allow yourself a certain amount of imperfection to keep moving forward. If you burn through that budget, you pause new feature work to focus on stabilizing the process. This prevents the team from optimizing for speed at the expense of quality.
Configuring Alerts That Don’t Cause Fatigue
Alerts are useless if they cause alert fatigue. If your team gets pinged every time a PR takes 25 hours instead of 24, they’ll ignore the alerts entirely. Effective alerting for maintainability requires multi-window burn rate strategies.
Here’s how to structure it:
- Critical Window (6 hours): Alert if a metric degrades rapidly. For example, if MTTR doubles within six hours, someone needs to investigate immediately.
- Trend Window (72 hours): Alert if there’s a gradual degradation. If PR cycle times have been slowly increasing over three days, it suggests a growing bottleneck that needs attention before it becomes a crisis.
Avoid cause-based alerts. Don’t alert on "high cyclomatic complexity" because that’s a static code analysis result that developers can address later. Instead, alert on symptom-based metrics like "increased rollback frequency." Rollbacks are a clear sign that recent changes are unstable. This approach keeps the team focused on outcomes rather than internal code metrics.
Also, implement cooldown periods. During planned maintenance or major releases, temporarily mute non-critical maintainability alerts. This ensures that when an alert does fire, it’s genuine and requires action.

Common Pitfalls to Avoid
Even with good intentions, many teams struggle with maintainability SLOs. Here are the most common traps:
- Data Silos: Acceldata’s research shows that 61% of teams struggle to connect code quality metrics with operational performance. Ensure your CI/CD pipeline, version control, and monitoring tools talk to each other. If your deployment tool doesn’t feed data into your dashboard, you’re flying blind.
- Vanity Metrics: Tracking "lines of code" or "number of commits" gives a false sense of productivity. Focus on outcomes like lead time and failure rates.
- Ignoring Business Alignment: Charity Majors, CTO of Honeycomb, notes that maintainability SLOs must link to business value. If you optimize for fast PR merges but ship buggy features, you’ve failed. Tie your SLOs to customer satisfaction or revenue impact where possible.
- Rushing Implementation: Gartner recommends establishing foundational operational SLOs (like uptime) before adding maintainability metrics. If your system is constantly crashing, fixing the codebase won’t help until stability is restored.
Implementation Roadmap
Adopting maintainability SLOs is a journey, not a switch you flip. Follow this phased approach to ensure success:
- Phase 1: Setup (Weeks 1-4): Define no more than three initial SLIs. Start with Deployment Frequency, Change Failure Rate, and MTTR. Gather historical data to establish baselines.
- Phase 2: Monitoring Integration (Weeks 5-8): Connect your data sources. Use tools like AWS CloudWatch Application Signals or dedicated platforms like Nobl9 to visualize these metrics alongside traditional performance data.
- Phase 3: Operational Integration (Weeks 9-12): Configure alerts using the multi-window strategy described above. Train the team on how to respond to these specific alerts.
- Phase 4: Continuous Refinement (Ongoing): Review SLOs quarterly. Adjust targets based on improvements. Add new SLIs only when necessary, such as Technical Debt Ratio, once the core metrics are stable.
Remember, the goal isn’t perfection. The goal is visibility. When you can see that your maintainability is slipping, you can act before it becomes a crisis. This proactive stance reduces engineer burnout, improves customer satisfaction, and ultimately makes your product more competitive in the market.
How do maintainability SLOs differ from standard operational SLOs?
Standard operational SLOs focus on user-facing metrics like uptime and latency. Maintainability SLOs focus on the internal health of the development process, measuring how easily the system can be changed and fixed. While operational SLOs ensure the system works now, maintainability SLOs ensure it remains workable in the future.
What is a good target for Mean Time to Recovery (MTTR)?
There is no universal target, as it depends on your industry and system complexity. However, a common benchmark for high-performing teams is under 1 hour. Start by measuring your current average and aim to reduce it by 10-20% initially.
Should I track technical debt as an SLO?
Yes, but carefully. Technical debt ratio (cost to fix vs. cost to develop) is a valuable indicator. However, it can be difficult to quantify accurately. Start with simpler metrics like Change Failure Rate before introducing complex debt calculations.
How do I prevent alert fatigue with maintainability metrics?
Use multi-window burn rate alerts. Set short windows (e.g., 6 hours) for critical, rapid degradations and longer windows (e.g., 72 hours) for gradual trends. Avoid alerting on static code metrics and focus on symptomatic outcomes like rollbacks or increased cycle times.
Do I need special tools to implement maintainability SLOs?
Not necessarily, but specialized tools help. Platforms like Nobl9, Blameless, or AWS CloudWatch Application Signals offer built-in support for SLO management and multi-window alerting. Generic monitoring tools can work but often require significant custom configuration.